Noviq
I built Noviq Engine to test whether a dashboard's own history supports a forecast. It runs on company-controlled infrastructure, shows the uncertainty and marks weak evidence as inconclusive.
Current status: In progress
Why I built it
Noviq came from a question I kept running into while building dashboards: how do you tell which pattern is solid enough to use?

The charts looked certain.
While I was building data-heavy dashboards, I kept seeing the same gap. A chart can look convincing long before its conclusion is trustworthy.

A chatbot could answer fast.
It could also send sensitive company data outside the systems the company controls, then return a fluent answer with little evidence behind it.

Make the software show its work.
Noviq only labels a result established when its checks support it. With weaker evidence, it returns inconclusive or abstains. Forecasts can still be wrong.
How it works
Each forecast comes from repeatable statistical checks. The dashboard receives the number together with the evidence label Noviq gave it.
01
Run it where the data lives
Noviq can sit beside the dashboard on infrastructure the company controls. Historical company data does not have to be uploaded to a hosted AI service for the engine to analyse it.
02
Keep the answer hidden
The latest known period becomes an untouched answer sheet. The engine makes its choices without seeing that future, then checks them against what actually happened.
03
Start with simple rules
Noviq tests several forecast methods and compares them with simple rules such as repeating recent history. A more complex method only wins when the backtests support it.
04
Run the test again
The engine repeats the test at different points in the history. It forecasts, reveals what happened and moves forward. A single good result cannot carry the whole case.
05
Show the range
Each forecast includes a range. Noviq checks how often reality lands inside it, then reports what the history says about that uncertainty. The range is not a guarantee.
06
Keep the evidence label
The dashboard gets one of three outcomes: established, inconclusive or no result. Noviq abstains when it cannot test itself reliably.
Example
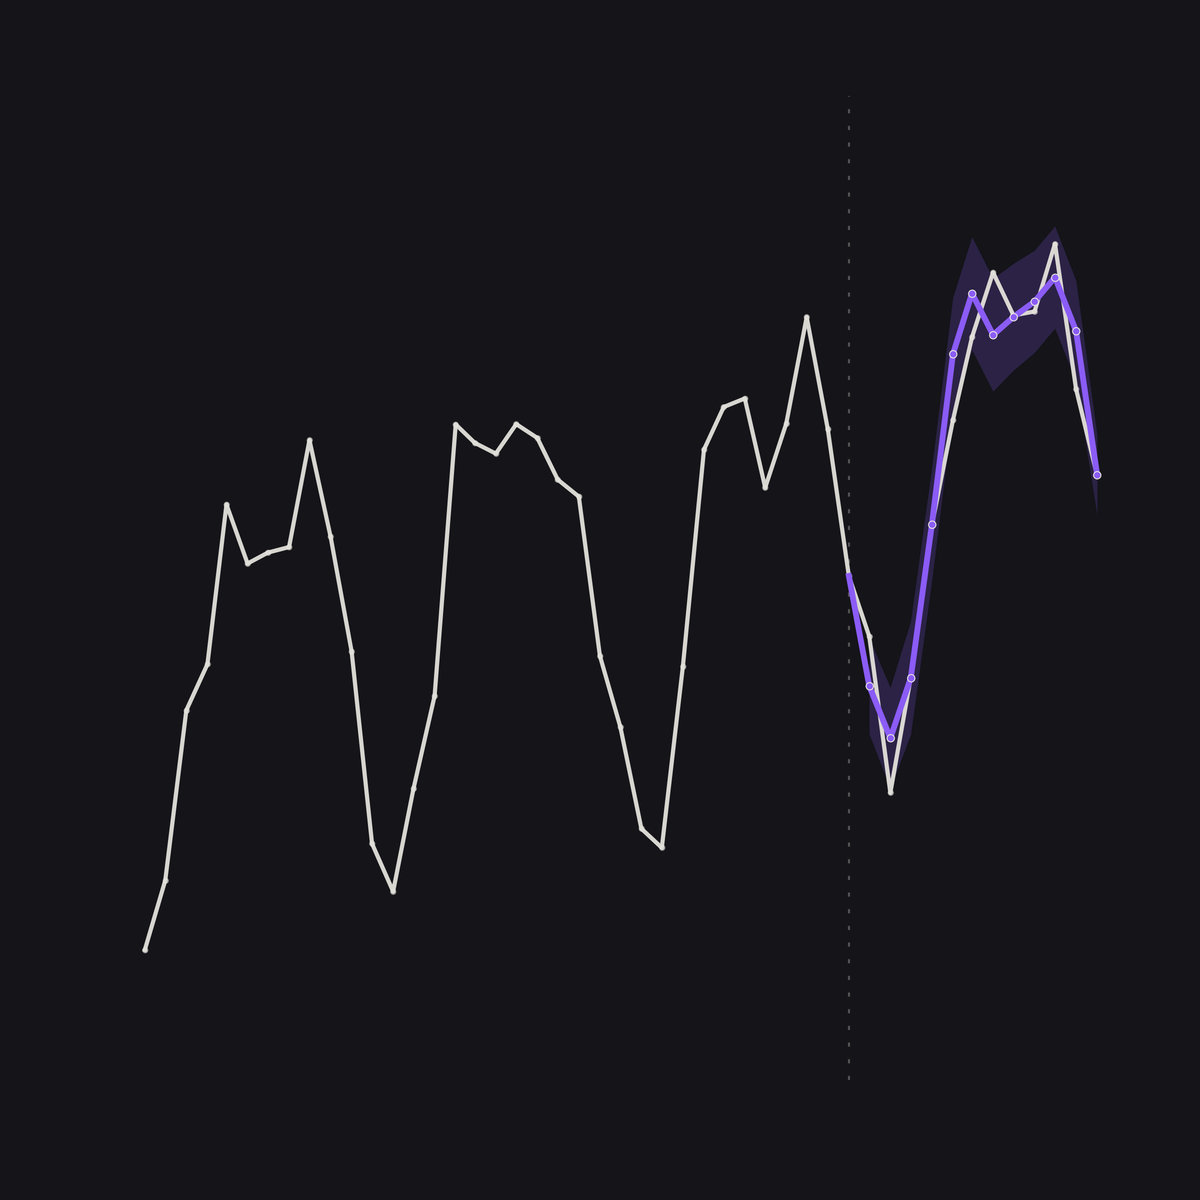
This example uses private demand planning. Suppose a team already has years of monthly demand in a dashboard. Noviq can sit beside it on infrastructure the company controls and check whether that history supports a forecast.
The chart replays one saved run on synthetic benchmark data. It shows the workflow and does not represent average performance.
The recorded run in numbers
- Forecast error against the baseline
- 49%lower average forecast error than repeating the previous year, across the run's repeated tests on earlier periods.
- Interval coverage
- 9/12held-out months landed inside the forecast range.
Both figures come from one saved Noviq Engine v1 run on synthetic benchmark data, recorded 2026-07-14; the chart above replays that run — nothing is simulated live, and the numbers are not an average performance claim. The engine itself still marks this run inconclusive.